Unlock growth opportunity by exploring your data.
Below is everything you need to know about the data on your analytics dashboard.
Have questions? Email us at digital@whiskercloud.com and our team will be there to help.

Dashboard Breakdown:
How To Read Your Website and Agency Services Analytics Dashboard
Welcome to your comprehensive analytics dashboard designed to give you real-time* insights into your website’s performance, advertising efforts, and social media engagement. Data insights can make a significant difference in understanding your clients, refining your strategies, and growing your business online.
Our analytics dashboard is tailored to provide you with valuable information about how users interact with your website, the effectiveness of your advertising campaigns, and the impact of your social media presence. With this tool, you’ll be empowered to make informed decisions, enhance user experiences, and unlock new opportunities for success.
Below, you will find a helpful guide to exploring each section of your analytics dashboard. Make sure to bookmark this guide and your analytics dashboard link!
The data for this dashboard is provided by GA4 and Facebook. PetDesk is unable to alter this data or labels in the dashboard. For additional data insights, please request access to your GA4 account by contacting digital@whiskercloud.com.
*Real-time: Your analytics dashboard updates approximately every 24 hours, providing you with data for yesterday and beyond.
Selecting a Time Period
All of your data is broken down on a month-to-month basis. When looking at your dashboard, make sure to select the correct month in the top-right corner of the dashboard portal.
What it looks like:

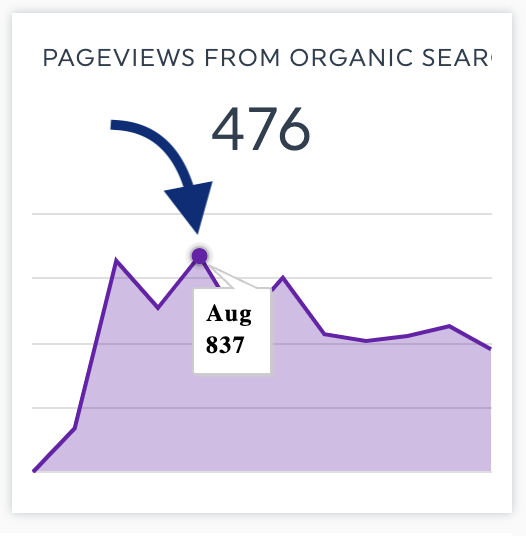
Tip: There are month-over-month views for key metrics. Hover over the bar graphs and line graphs to reveal previous months’ data. (See examples below)

Website Conversions
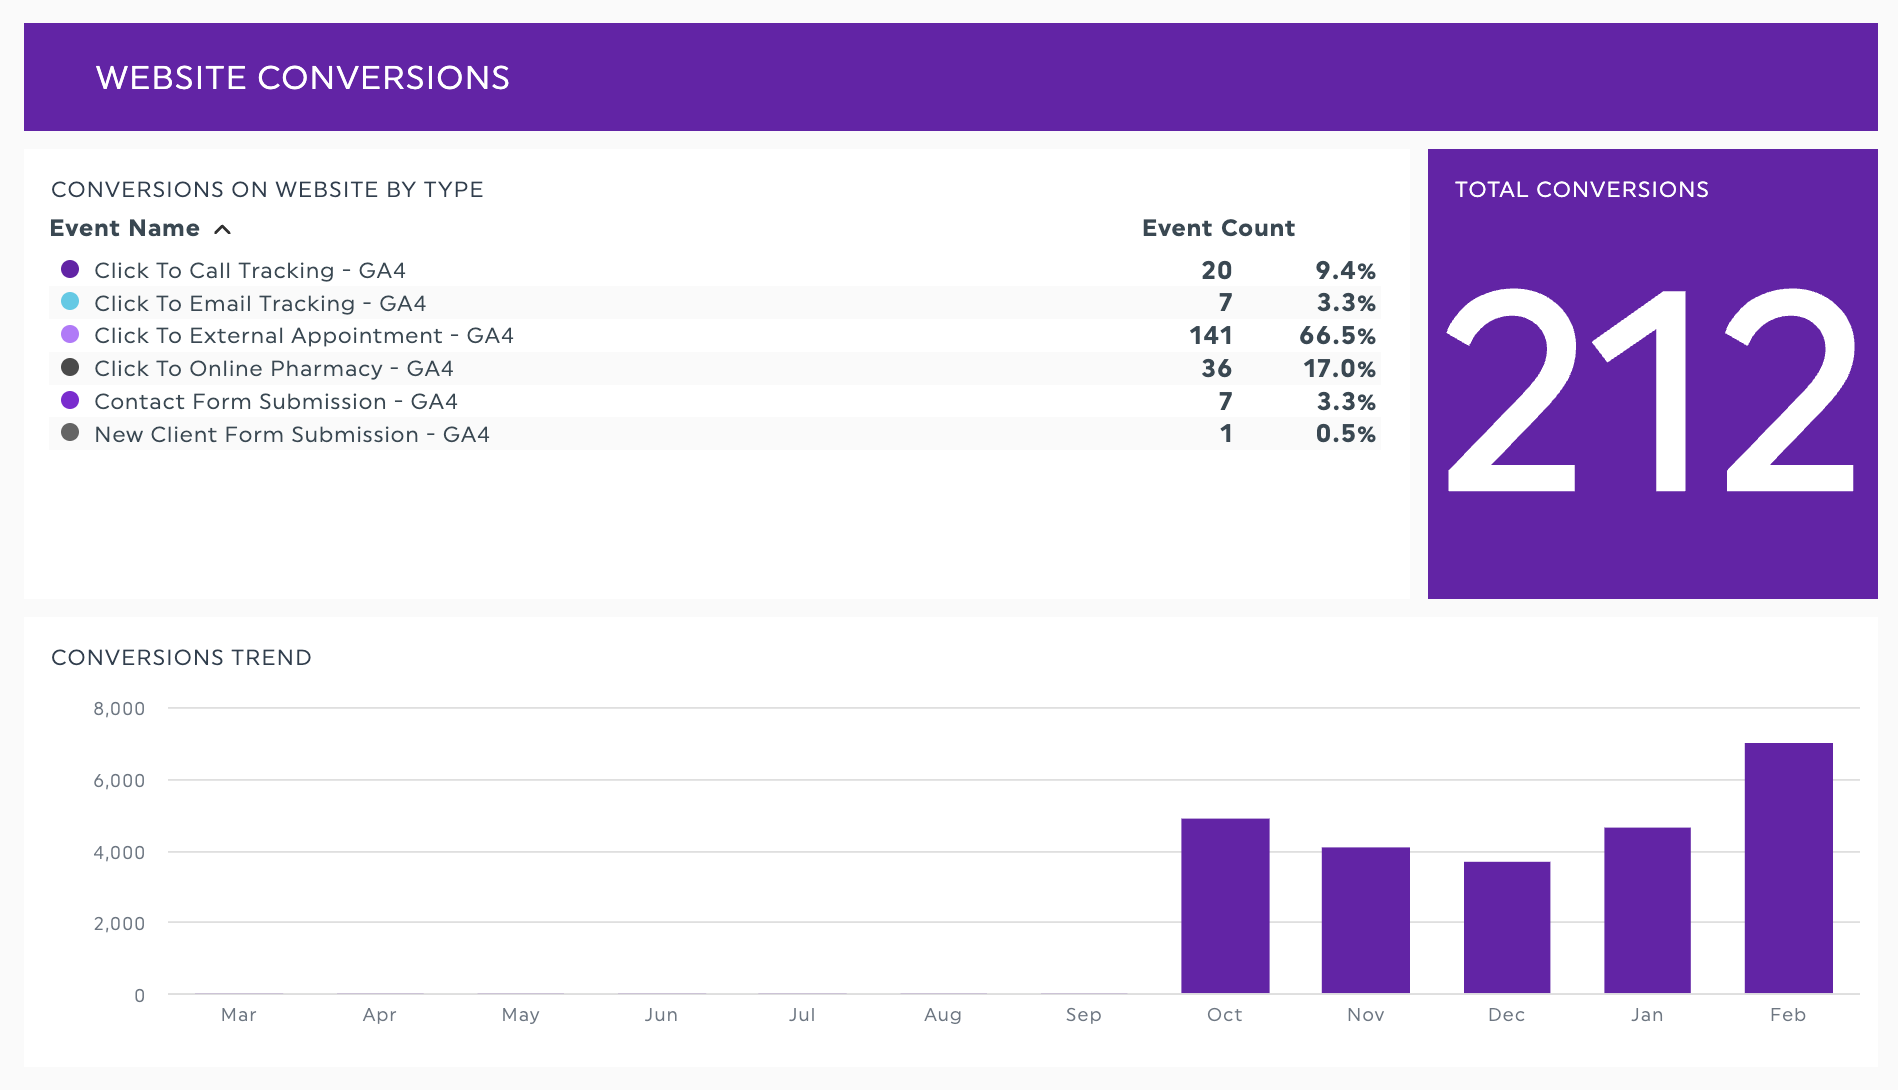
This section keeps track of all of the conversions on your website. These conversions are attributed when someone completes an action, called an “event,” on your website. These actions can be things like requesting an appointment or refill, completing a contact form, or using their mobile device to click-to-call or click-to-email you. These conversions are updated approximately every 24 hours. Below are common conversion types you’ll see in your reporting.
Common Conversion Types:
- Click to Call
- Click to Email
- Click to External Appointment (this label may vary depending on the hospital’s booking method)
- Click to Online Store (or Online Pharmacy)
- Contact Form Submission
- New Client Form Submission
Please note: These numbers do not include people who land on your website and just dial your number or call to request an appointment. These numbers are specific things that happen on your website.
For our advertising clients: You’ll find conversion data in the Google Ads Data section of your analytics dashboard.
What it looks like:
Top Web Key Performance Indicators
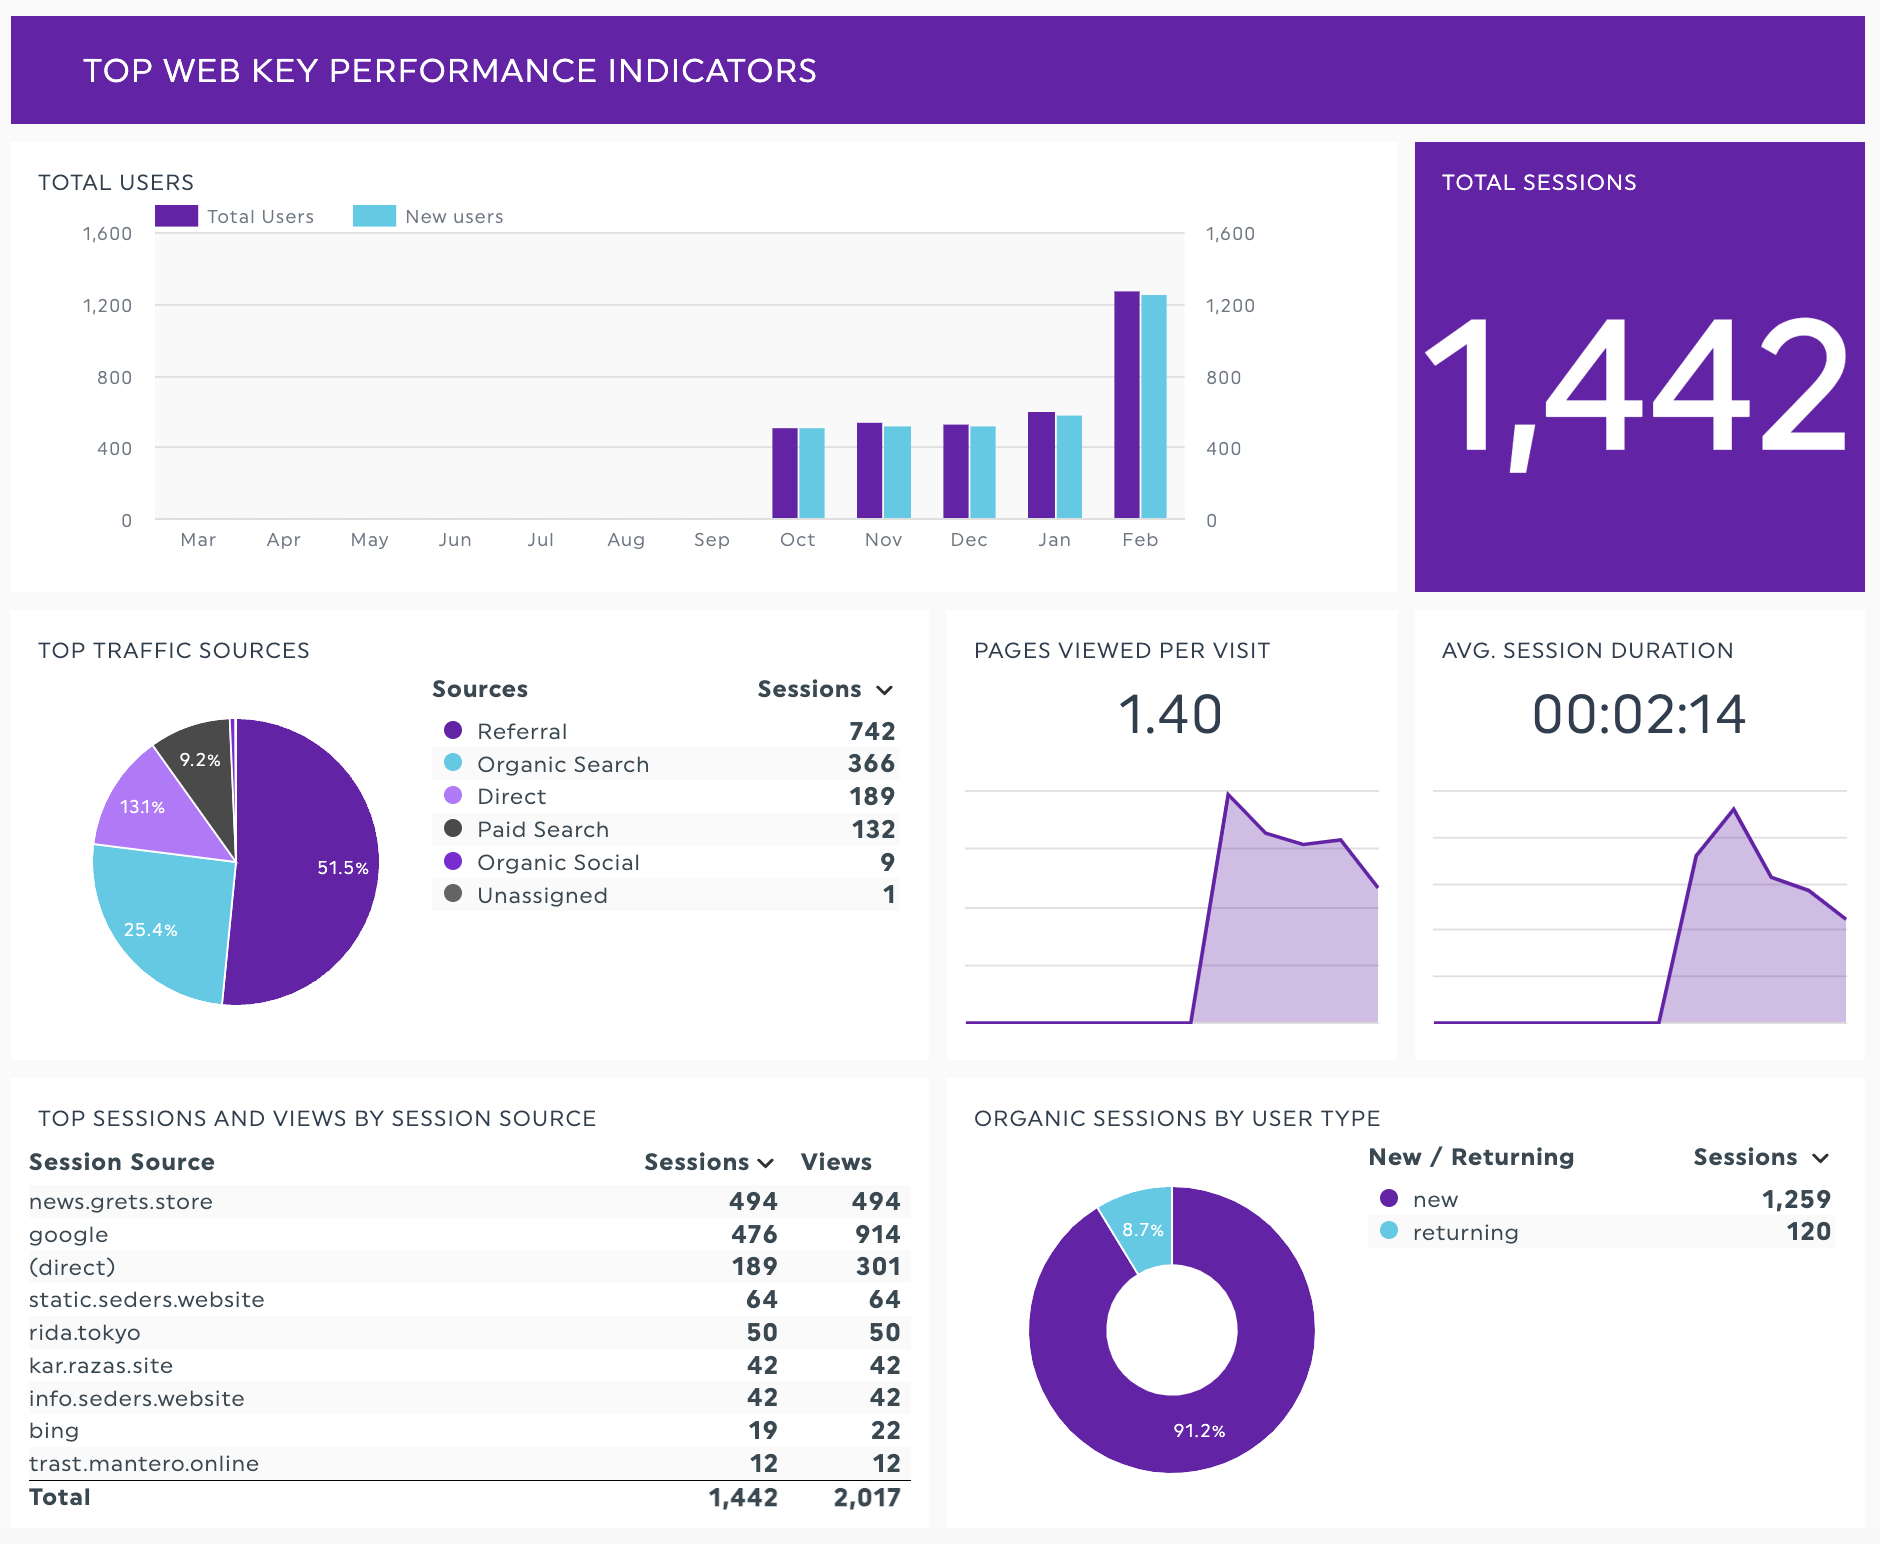
This section provides comprehensive insights into various metrics such as total users, sessions, top traffic sources, pages viewed per visit, average session duration, top converting pages, and more, allowing you to understand and optimize your website’s performance, user engagement, and audience reach effectively.
- Total Users: refers to the total number of unique individuals (or devices) that have interacted with your website within a specified time frame. This metric counts each user or device only once, regardless of how many times they visit or interact with your site during that period. It provides a broad overview of your website’s reach and audience size, helping you understand the overall impact of your digital marketing efforts and the level of user engagement on your site.
- Total Sessions: the overall number of times users have visited your website during the selected time period, counting each visit as a separate session regardless of how many times an individual user may have visited within that time frame.
- Top Traffic Sources: indicates which channels and websites are driving engagement. This is where we look at how people are finding your website!
- Organic search means they found you from a search engine like Google, Bing, or Yahoo.
- Direct traffic is most often the result of a user entering a URL into their browser or using a bookmark to access the site directly.
- Referral traffic is when someone clicks on a hyperlink to go to a new page on a different website; Analytics tracks the click as a referral visit to the second site.
- Organic social media traffic is all traffic that comes from social networks like Facebook, Instagram, and X (formerly known as Twitter).
- Paid search traffic comes from advertising like Google Adwords
- Unassigned traffic refers to visits where the source or medium of the user’s arrival on the website cannot be definitively determined. (This often occurs due to tracking issues or missing information.)
- Pages Viewed Per Visit: measures the average number of pages a user navigates during a single session, reflecting user engagement and interest in your website content.
- Average Session Duration: represents the average time users spend on your website in a single session, reflecting their level of engagement with your content.
- Top Session and Views By Session Source: provides insights into the sources driving sessions and views on your website, aiding in the evaluation and optimization of marketing strategies for maximizing traffic and engagement.
- Organic Sessions by User Type: indicates the number of sessions from organic search traffic segmented by user types, providing insights into user behavior and aiding in SEO and user experience optimization. The more new people finding you (through organic search and paid ads) is a good way to grow your business!
- Total Visits By Device: provides data on what devices your users are using to access your website.
- Top Keywords – Average Position: provides insight into the average ranking position of your website for specific keywords in search engine results pages, indicating its visibility and potential organic traffic.
- Top Converting Pages: indicates the web pages with the highest success rates in converting visitors into customers or achieving desired actions on your website. (“/” is the homepage)
Glossary:
- Unique User: This is how many individual people visited your site in the given time period. Each person can only count as one user per device in any period.
- Session: This is how many total times all users visited your website in a given time period. Each user can only count as one user but can account for multiple sessions within a specific time period.
- Pageviews: This is the total number of pages viewed on your website during a specific timeframe. Each person will count as one user but can account for multiple sessions and pageviews.
What it looks like:
Organic Search Data
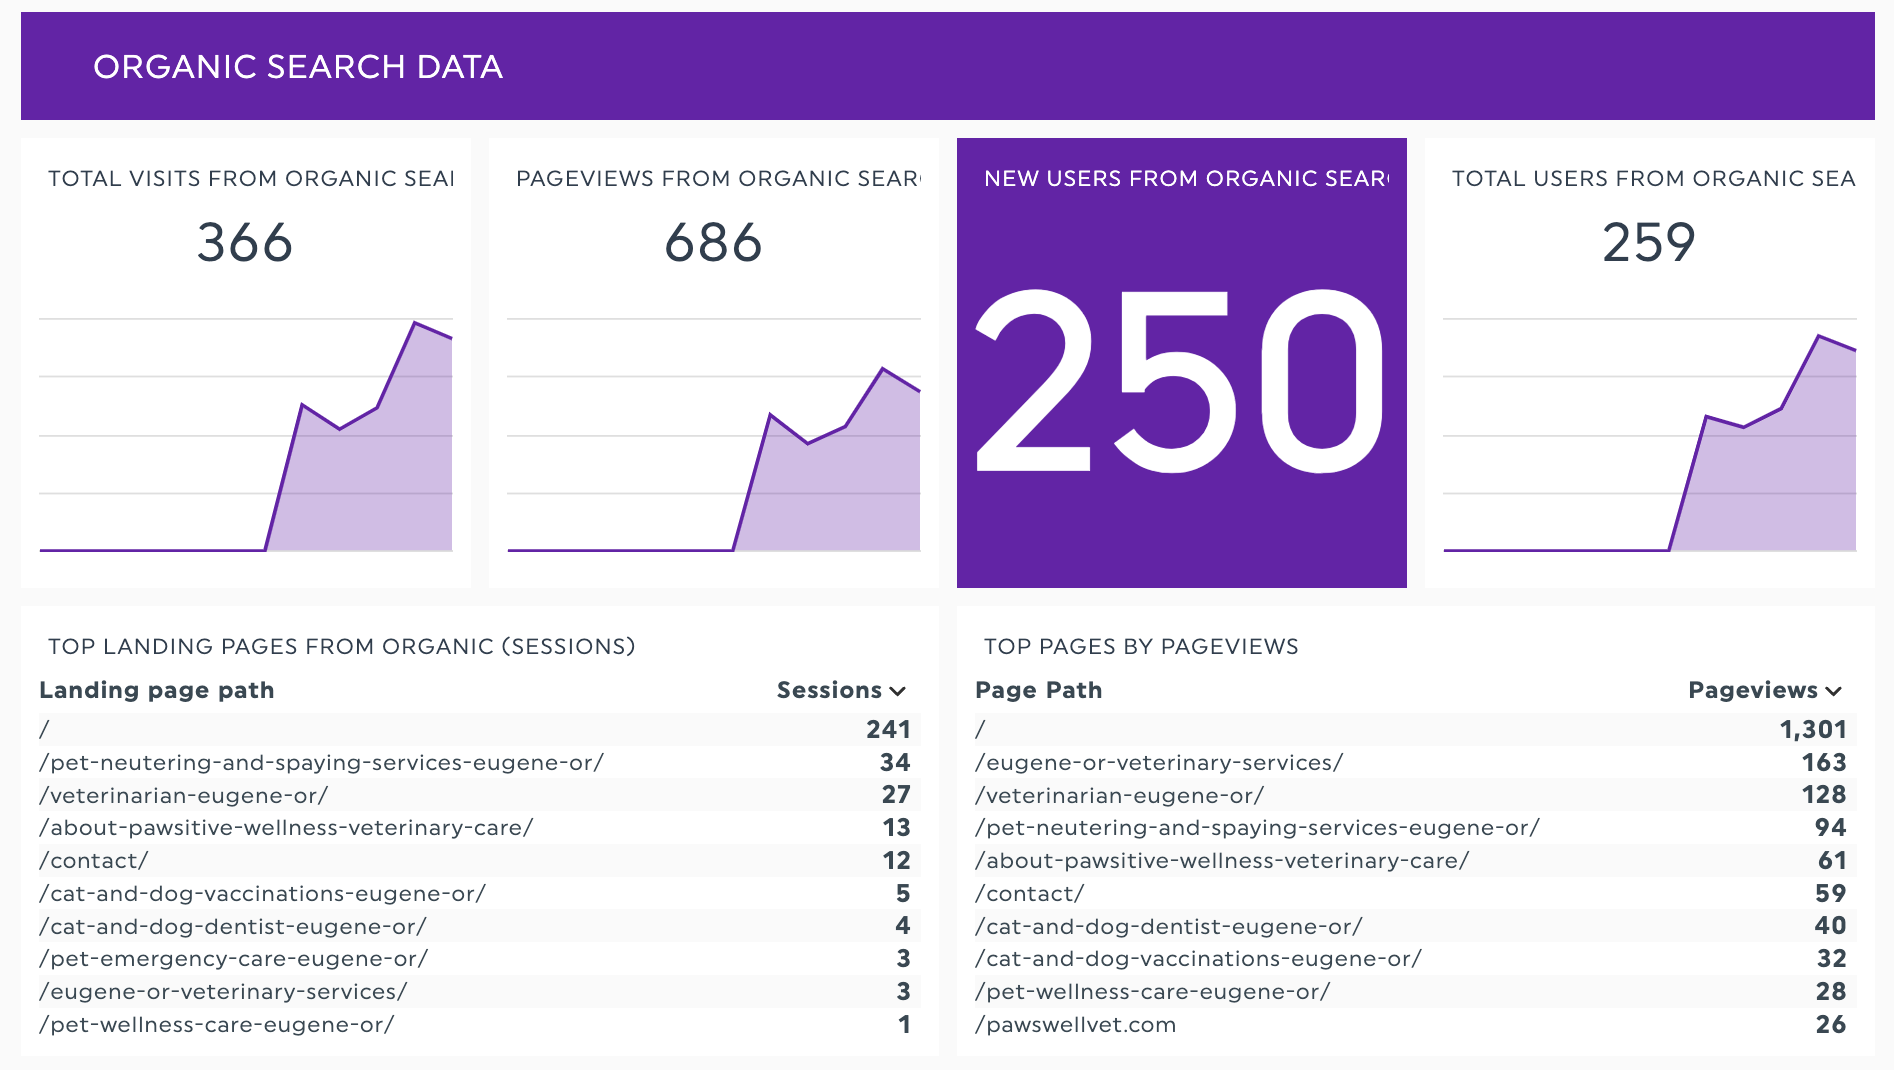
These numbers are identical to your critical performance indicator data but calculate data from people who found you on search engines such as Google.
- Total Visits From Organic Search: represents the total number of sessions on your website that came from unpaid, natural search engine results during the selected time period.
- Page Views From Organic Search: refers to the total number of pages viewed on your website by users who arrived through organic search engine results during the selected time period.
- New Users From Organic Search: the exact number of new users that came to your website through search engines during the selected time period. (This helps you see how many people are finding you when they’re looking for a new veterinarian on search engines.)
- Total Users From Organic Search: indicates the total number of unique individuals who accessed your website through organic search engine results within the selected time period.
- Top Landing Pages From Organic (Sessions): refers to the web pages on your website that received the most initial visits from users who arrived through organic search engine results.
- Top Pages By Pageviews: refers to the web pages on your website that have received the highest number of views or visits from users, regardless of the traffic source. This metric helps you identify which pages are the most popular or frequently visited by users, allowing you to focus on optimizing and improving the content, layout, and user experience of these pages.
What it looks like:
Facebook Data
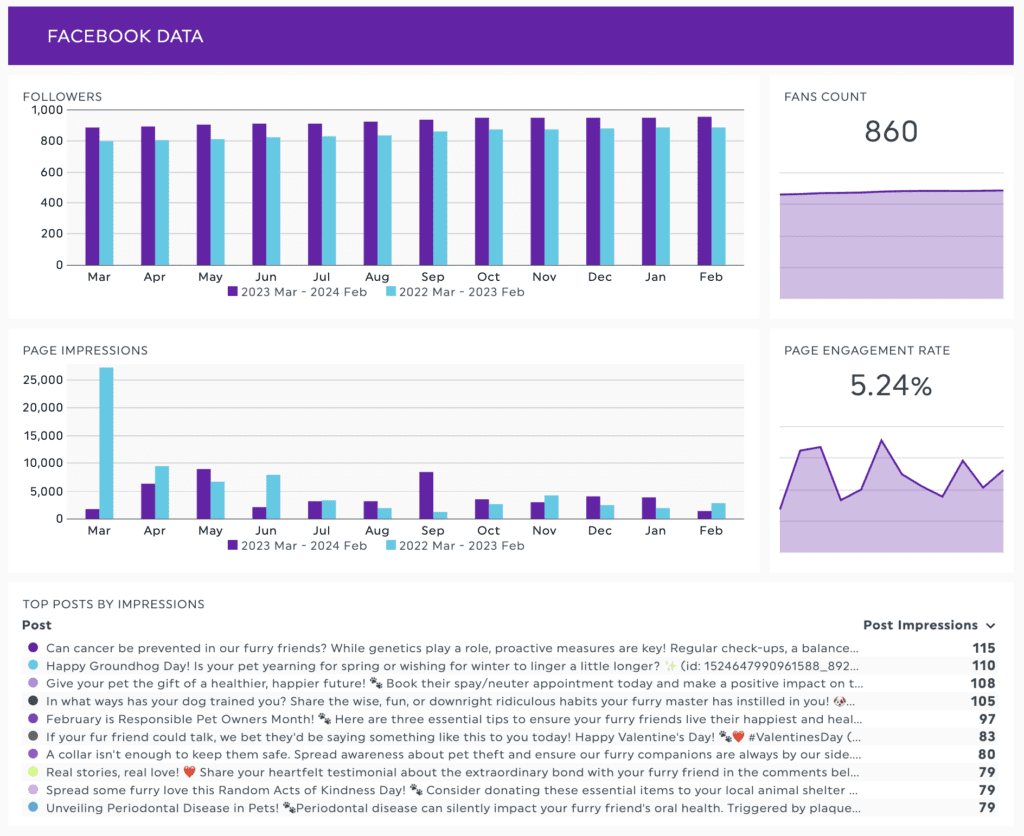
Here is the most important data when it comes to the growth of your Facebook page!
- Followers: individuals who have subscribed to your public updates, indicating interest in your content and serving as a measure of engagement and reach.
- This interactive historical graph will show you how your page has grown over time. More growth means growing your audience and giving yourself the ability to sell and convert new business for your brand!
- Fans Count: also known as likes or page likes, refers to the total number of users who have liked your Facebook Page. By liking your page they will receive updates and posts from your page in their news feed, and their interaction with your page’s content can contribute to engagement metrics.
- Page Impressions: the number of times your posts have been seen during the selected time period on Facebook. These numbers will fluctuate with seasonality and depending on the count that is being posted. This is a good reason to continue posting awesome content that gets engagement!
- Page Engagement Rate is the number of people who engaged with your Page divided by the number of people who saw any of your content. Please note that this metric will only show data for actions that occurred during your selected time period.
- Top Posts By Impressions: these are the posts that are picking up the most steam and getting sent throughout the month. This should allow you to understand better what your clients are enjoying that you post, and will guide you (and us) in creating new content they’ll love!
What it looks like:
Google Business Profile Data
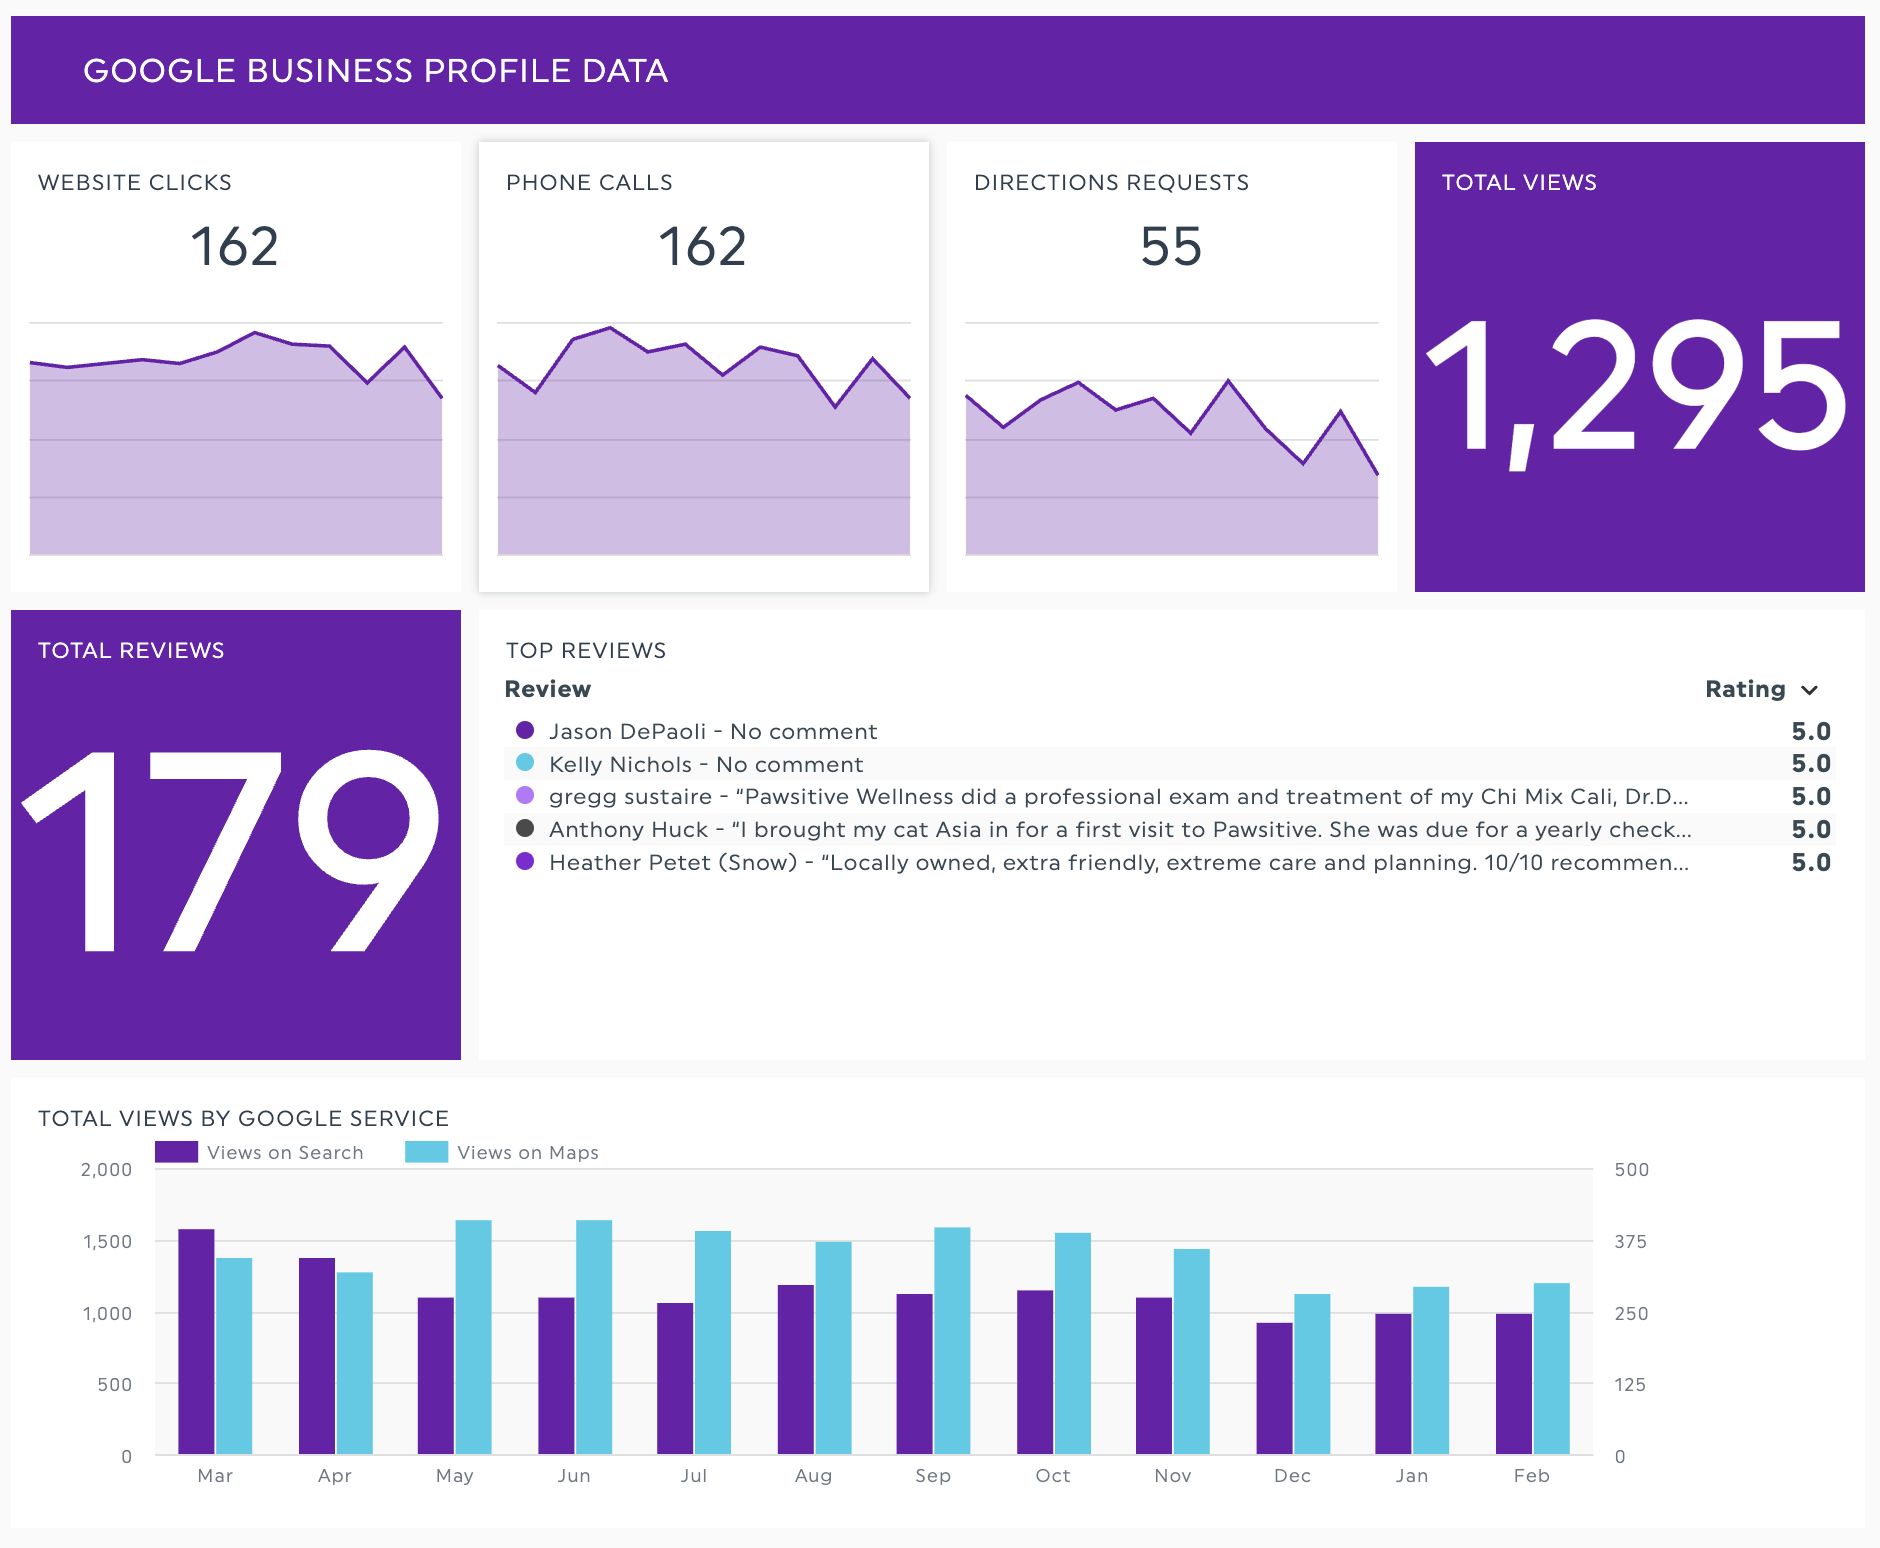
Google Business Profile allows the management of how your business appears on Google Search and Maps (example). It includes information such as your business name, address, phone number, website, hours of operation, reviews, photos, and more.
Often, users Google your business or services you offer and your Google Business Profile (GBP), formerly Google My Business, will be displayed by Google. This section highlights key actions taken by the user directly from your GBP.
Note: If this section is not populating, please reach out to digital@whiskercloud.com for instructions on providing us access to your Google Business Profile account.
- Website Clicks: The number of times someone found your business on Google and clicked “Website” directly in their search results, bringing them to your website directly. These numbers are not reflected in your conversion data of the dashboard but are just as important!
- Phone Calls: The number of times someone found your business on Google and clicked “Call” directly in their search results. These numbers are not reflected in your conversion data of the dashboard but are just as important!
- Directions Requests: The number of times someone found your business on Google and clicked “Directions” directly in their search results, bringing them Google Maps and giving them instant directions to your locations. These numbers are not reflected in your conversion data of the dashboard but are just as important!
- Total Views: The number of times someone found your business on Google throughout the month, but it does not mean that they clicked anything like “Call” or “Website.”
- Total Reviews: Represents the cumulative count of all reviews submitted by users.
- Top Reviews: Refers to the highest-rated or most positively reviewed content, products, or services you offer.
- Total Views By Google Service: These numbers show us how people found you, whether through a Google Search query or a Google Maps query. It’s essential to know how people find you online, and we want you to have this data.
Google Ads Data
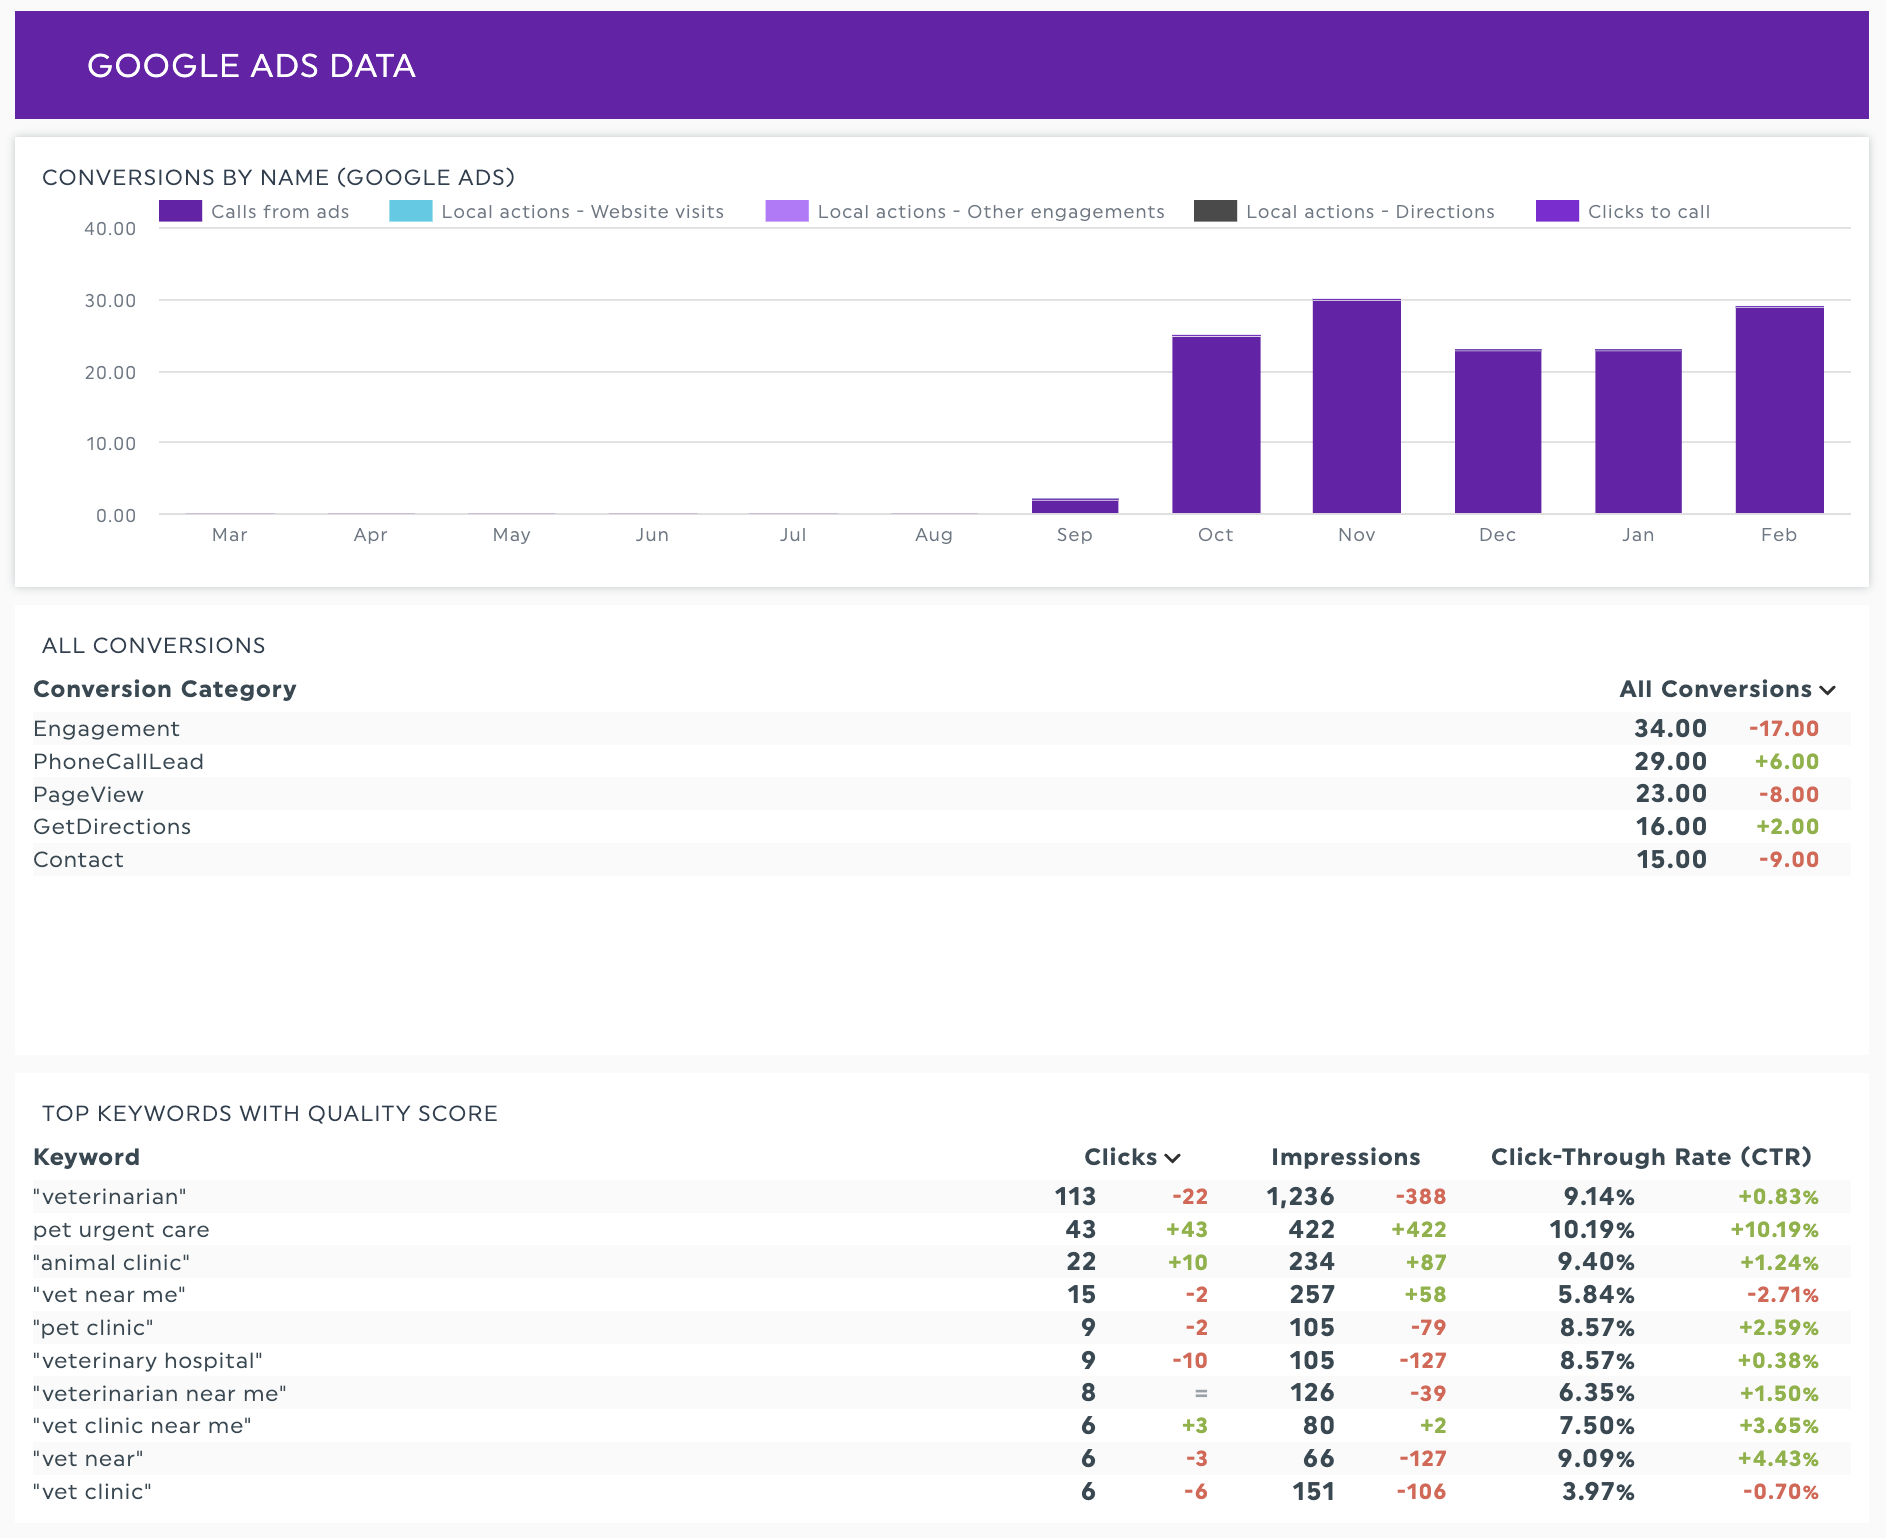
- Conversions by Name
- Conversion – An action that’s counted when someone interacts with your ad (for example, clicks a text ad or views a video ad) and then takes an action that you’ve defined as valuable to your business, such as an online purchase or a call to your business from a mobile phone.
- Conversions by Name – refers to the specific conversions or events tracked and categorized by their names within Google’s reporting, providing insights into which actions or interactions are driving desired outcomes.
- All Conversions – total number of conversions attributed to your Google Ads campaigns across all conversion types or actions that have been defined and tracked.
- Top Keywords With Quality Score – a report that shows the keywords in your campaigns along with their Quality Scores, aiding in identifying high-performing keywords and optimizing ad performance.
- Keywords – Words or phrases describing your product or service that you choose to help determine when and where your ad can appear. The keywords you choose are used to show your ads to people. Select high-quality, relevant keywords for your ad campaign to help you reach only the most interested people who are more likely to become your customers.
- It’s essential to know which keywords we’re targeting are performing best based on clicks, impressions, and cost. Quality scores change over time, but it’s still something we factor in when optimizing your ads!
- Keywords – Words or phrases describing your product or service that you choose to help determine when and where your ad can appear. The keywords you choose are used to show your ads to people. Select high-quality, relevant keywords for your ad campaign to help you reach only the most interested people who are more likely to become your customers.
- Phone Call Performance
- Phone Calls track the actual instances when users initiate phone calls by clicking on phone numbers or call extensions.
- Phone Impressions measure how often these phone numbers or call extensions are displayed to users in ad placements.
- Phone-Through Rate (PTR) calculates the percentage of users who make a call after seeing the ad.
- Impressions – how often your ad is shown. An impression is counted each time your ad is displayed on a search result page or another site on the Google Network. Each time your ad appears on Google or the Google Network, it’s counted as one impression.
- Conversions Rate (CVR) – the percentage of ad clicks that result in desired actions or conversions, reflecting the effectiveness of advertising campaigns in driving valuable outcomes.
- Click-through Rate (CTR) – A ratio showing how often people who see your ad end up clicking it. Clickthrough rate (CTR) can be used to gauge how well your keywords and ads are performing. CTR is the number of clicks that your ad receives divided by the number of times your ad is shown: clicks ÷ impressions = CTR. For example, if you had five clicks and 100 impressions, your CTR would be 5%.
- Clicks – When someone clicks your ad, like on the blue headline of a text ad, Google Ads counts that as a click. Clicks can help you understand how well your ad appeals to people who see it. Relevant, highly-targeted ads are more likely to receive clicks.
- Cost-per-click (CPC) – Cost-per-click (CPC) bidding means that you pay for each click on your ads. For CPC bidding campaigns, you set a maximum cost-per-click bid – or simply “max. CPC” – that’s the highest amount that you’re willing to pay for a click on your ad.
- Campaign Spend Breakdown – your spending across different campaign types, organized by daily budget allocations.
- Media Spend – tracks the amount of money allocated and spent in Google Ads. (This amount does not include your monthly management fee.)
- Clicks (ad group) – total number of times users clicked on ads within a specific ad group.
- Clicks (campaign) – total number of times users clicked on ads within a specific campaign.
Tip: For a quick health check of your campaigns that have been running for at least 90 days, please use these performance benchmarks (see below).
- CTR: 5-7% (if your CTR is below this benchmark it might be underperforming.)
- CPC: $3 (if your CPC is above this benchmark, there might be room for improvement.)
- CVR: 10-20% (if your CVR is below this benchmark it might be underperforming.)
What it looks like:
If you have any questions about your analytics dashboard please reach out to digital@whiskercloud.com.
